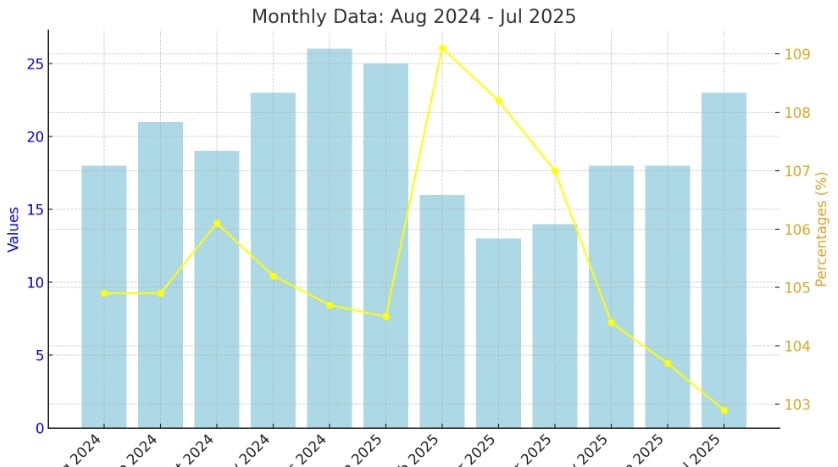
Santa Clara County (SCC) from August 2024 to July 2025 shows how quickly homes sold and how much they sold for compared to the list price. The light blue bars reveal that homes sold fastest in March 2025 at just 13 days on average, while December 2024 and July 2025 were slower, at 26 and 23 days. The yellow line shows that homes sold above asking price all year, peaking in February 2025 at 109.1 percent of list price and easing to 102.9 percent by July 2025. Overall, the market was very competitive, with early spring 2025 being the busiest period, while late 2024 and mid-2025 showed more seasonal slowdowns.
Alameda: Average Days on Market and Sale to List Price Ratio
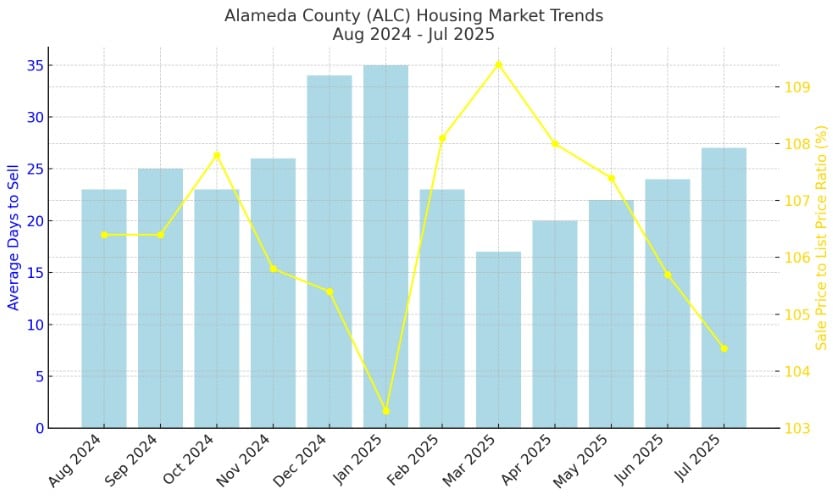
Alameda County (ALC) from August 2024 to July 2025 shows how long homes took to sell and how much they sold for compared to the list price. The light blue bars highlight that homes sold in as few as 17 days in March 2025 and as many as 35 days in January 2025, with December also slowing to 34 days. The yellow line shows that homes consistently sold above asking price, peaking in March 2025 at 109.4 percent of list price and dipping to 103.3 percent in January 2025. Overall, the market stayed very competitive, with early 2025—especially February through April—being the busiest period, while late 2024 and mid-2025 were slower.
San Mateo County: Average Days on Market and Sale to List Price Ratio
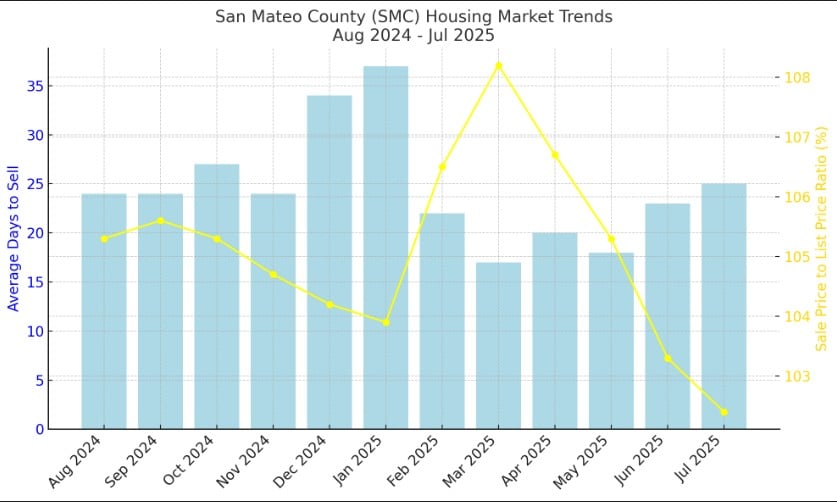
San Mateo County (SMC) from August 2024 to July 2025 highlights both the pace of home sales and the relationship between sale and list prices. The light blue bars show that homes typically sold within 17 to 37 days, with the fastest sales occurring in March 2025, when properties averaged just 17 days on the market, and the slowest in January 2025, when sales stretched to 37 days. December 2024 also reflected a holiday slowdown, averaging 34 days to sell. The yellow line shows that homes consistently sold above list price, with the strongest competition appearing in March 2025 at 108.2 percent of asking, and the weakest in July 2025, when the ratio eased to 102.4 percent. Overall, the graph demonstrates a highly competitive market where buyers frequently paid more than list price, with early spring 2025 standing out as the most active and aggressive period, while late 2024 and mid-2025 reflected slower, more balanced conditions.
Los Angeles: Average Days on Market and Sale to List Price Ratio
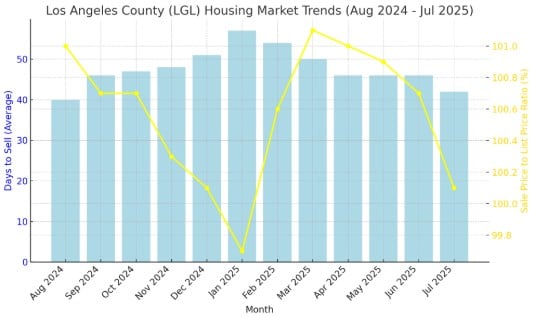
Homes generally sold within 40 to 57 days, peaking in January 2025 at 57 days before trending downward again. Meanwhile, the sale price to list price ratio stayed very close to 100%, meaning most homes sold at or slightly above the asking price. The highest ratio was in March 2025 (101.1%), showing a competitive market with buyers paying above list price.
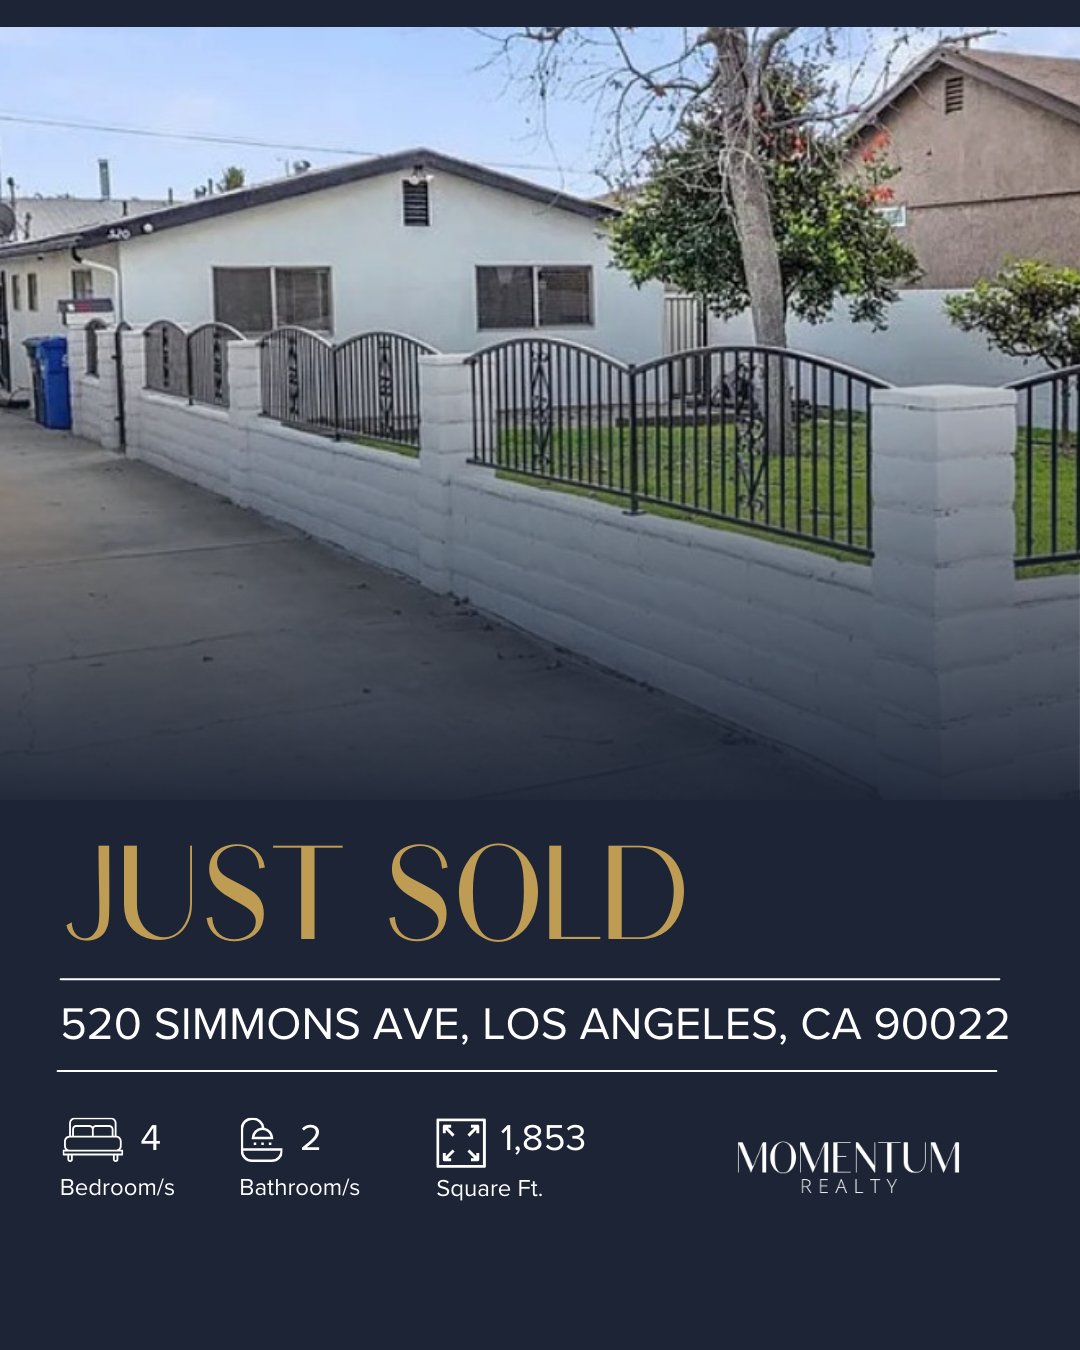
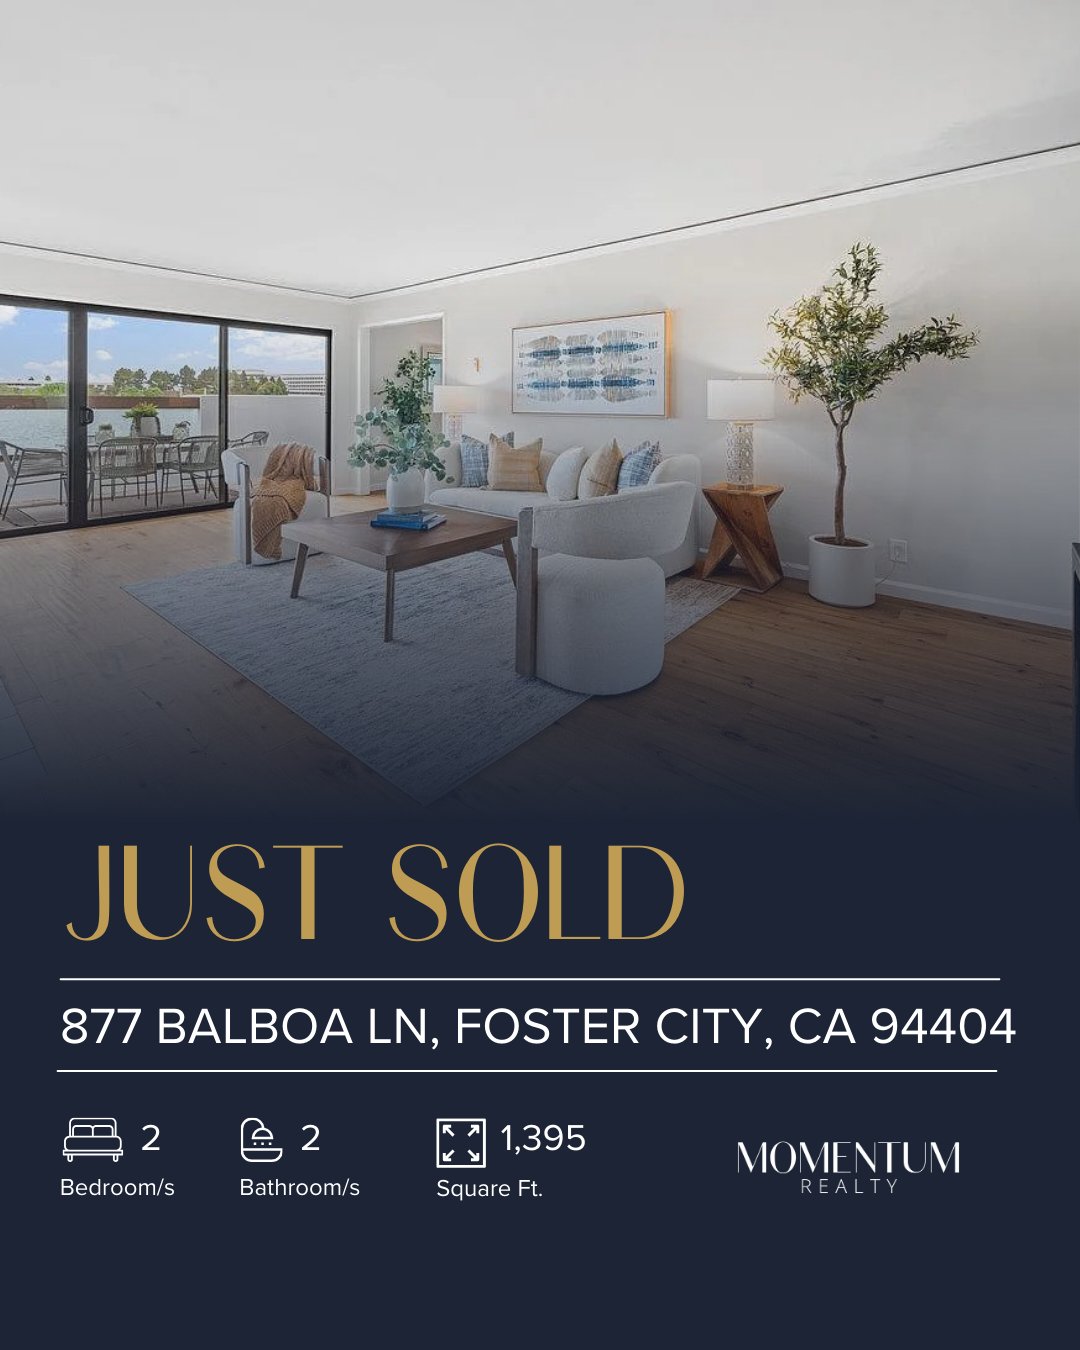
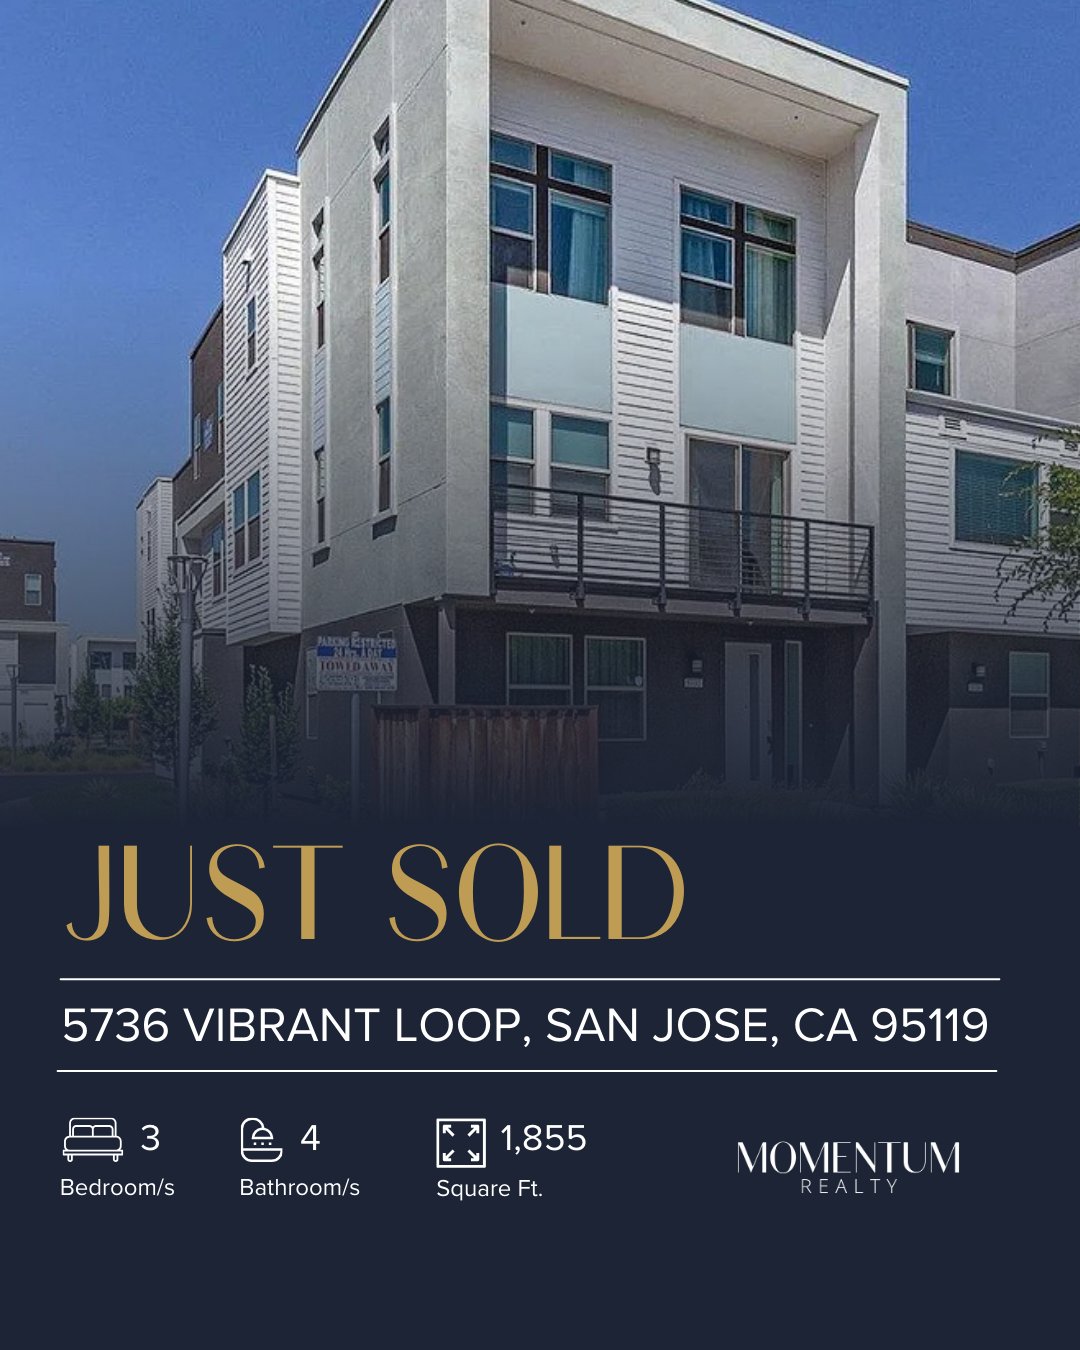
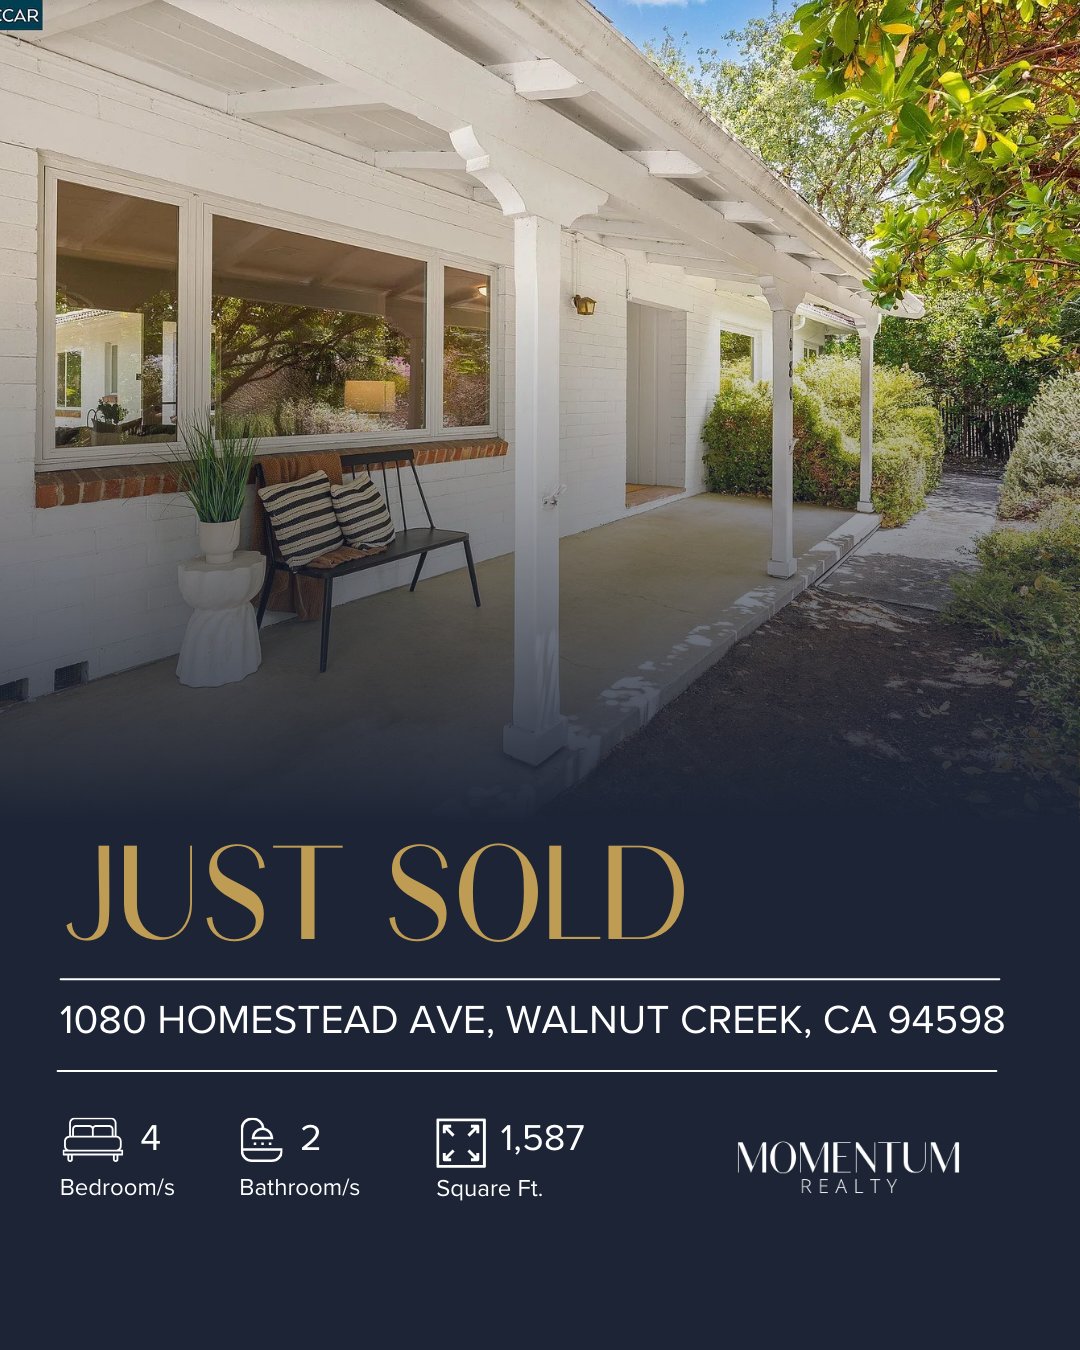
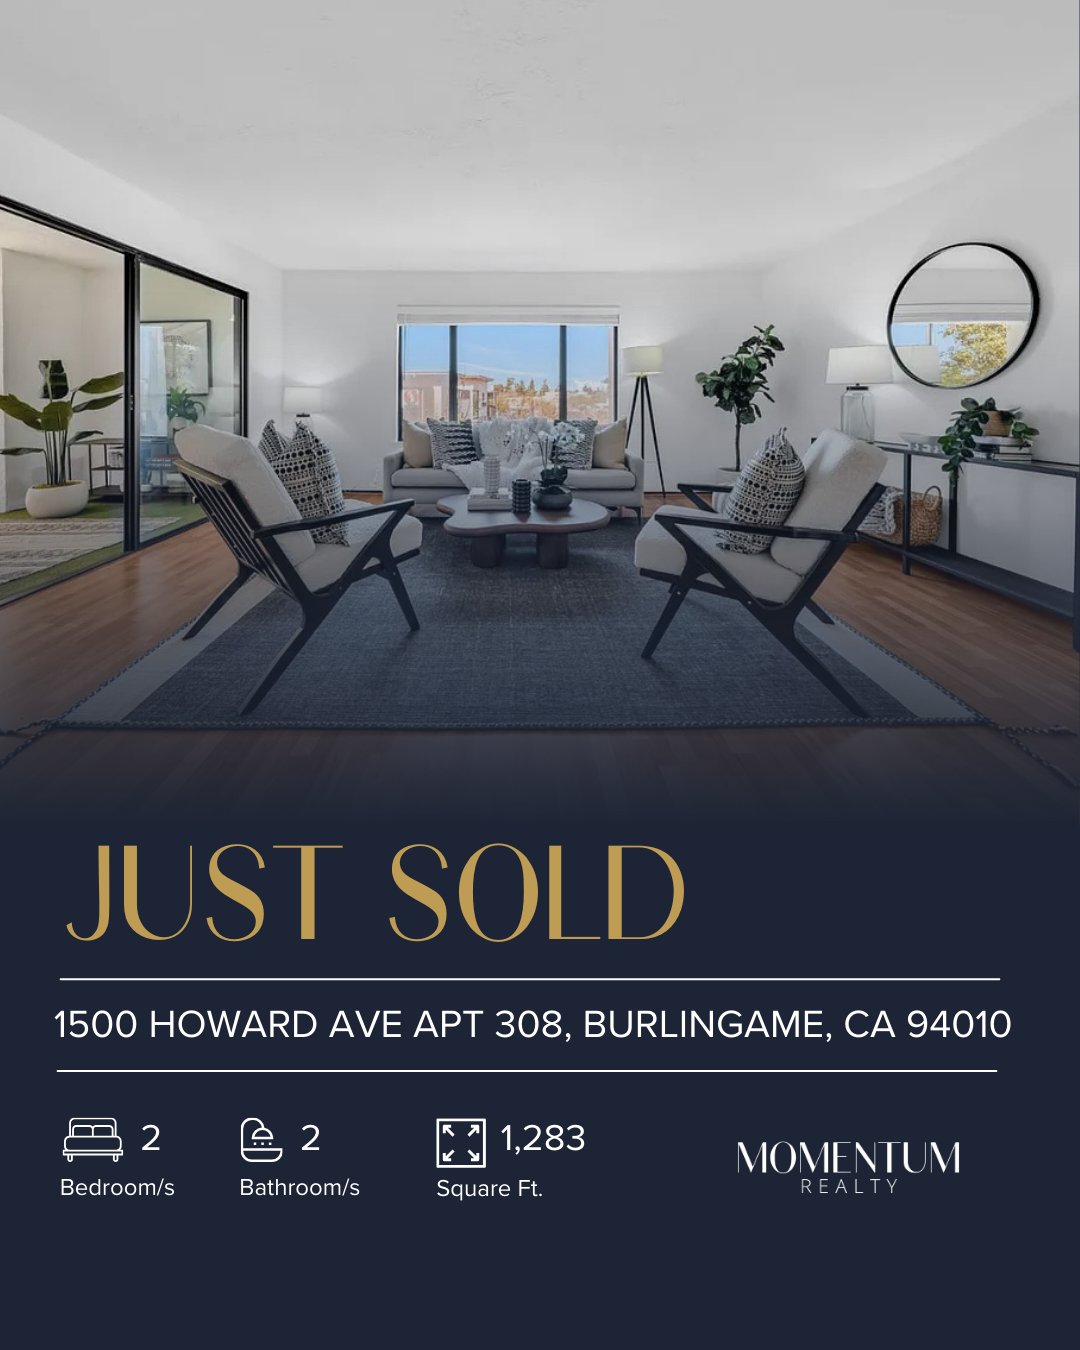
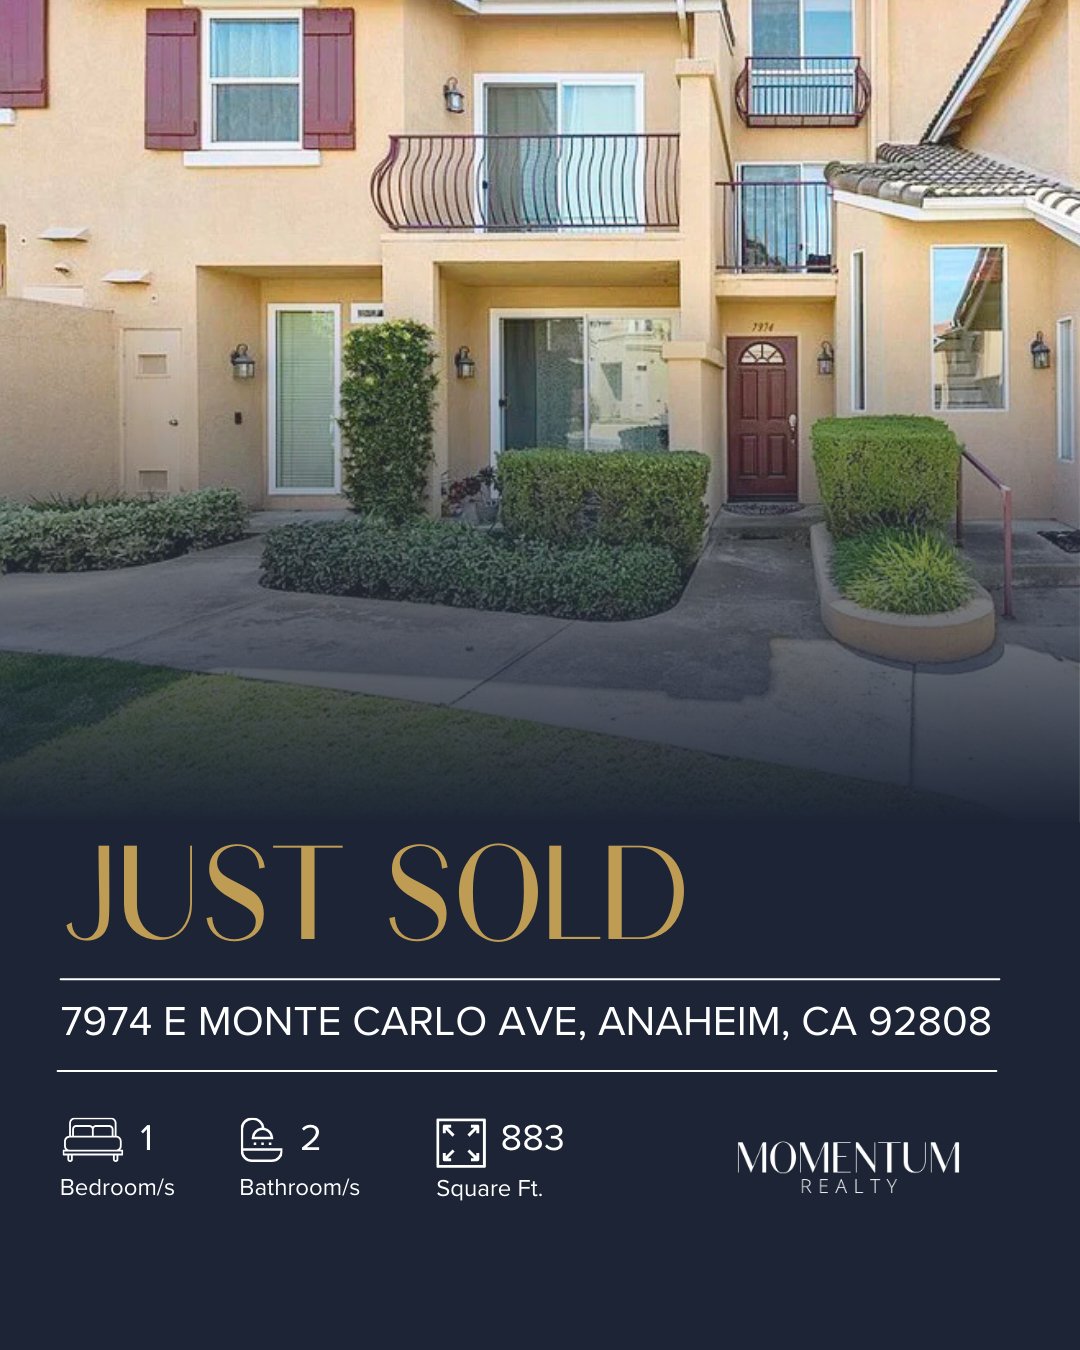
Congratulations to our clients on their successful closings this month!
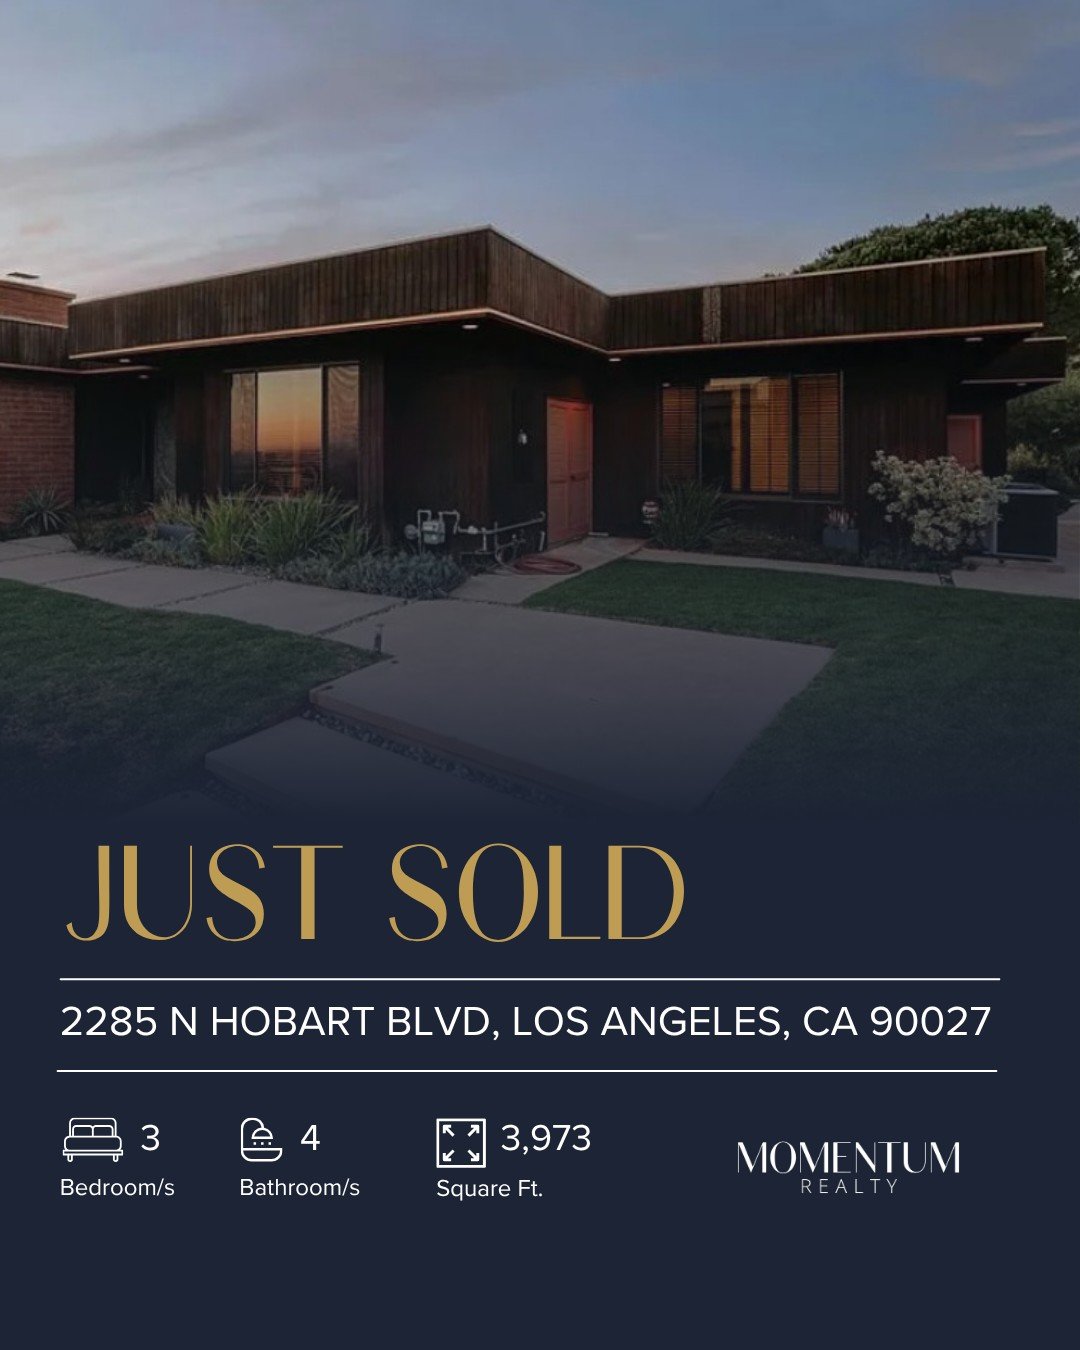
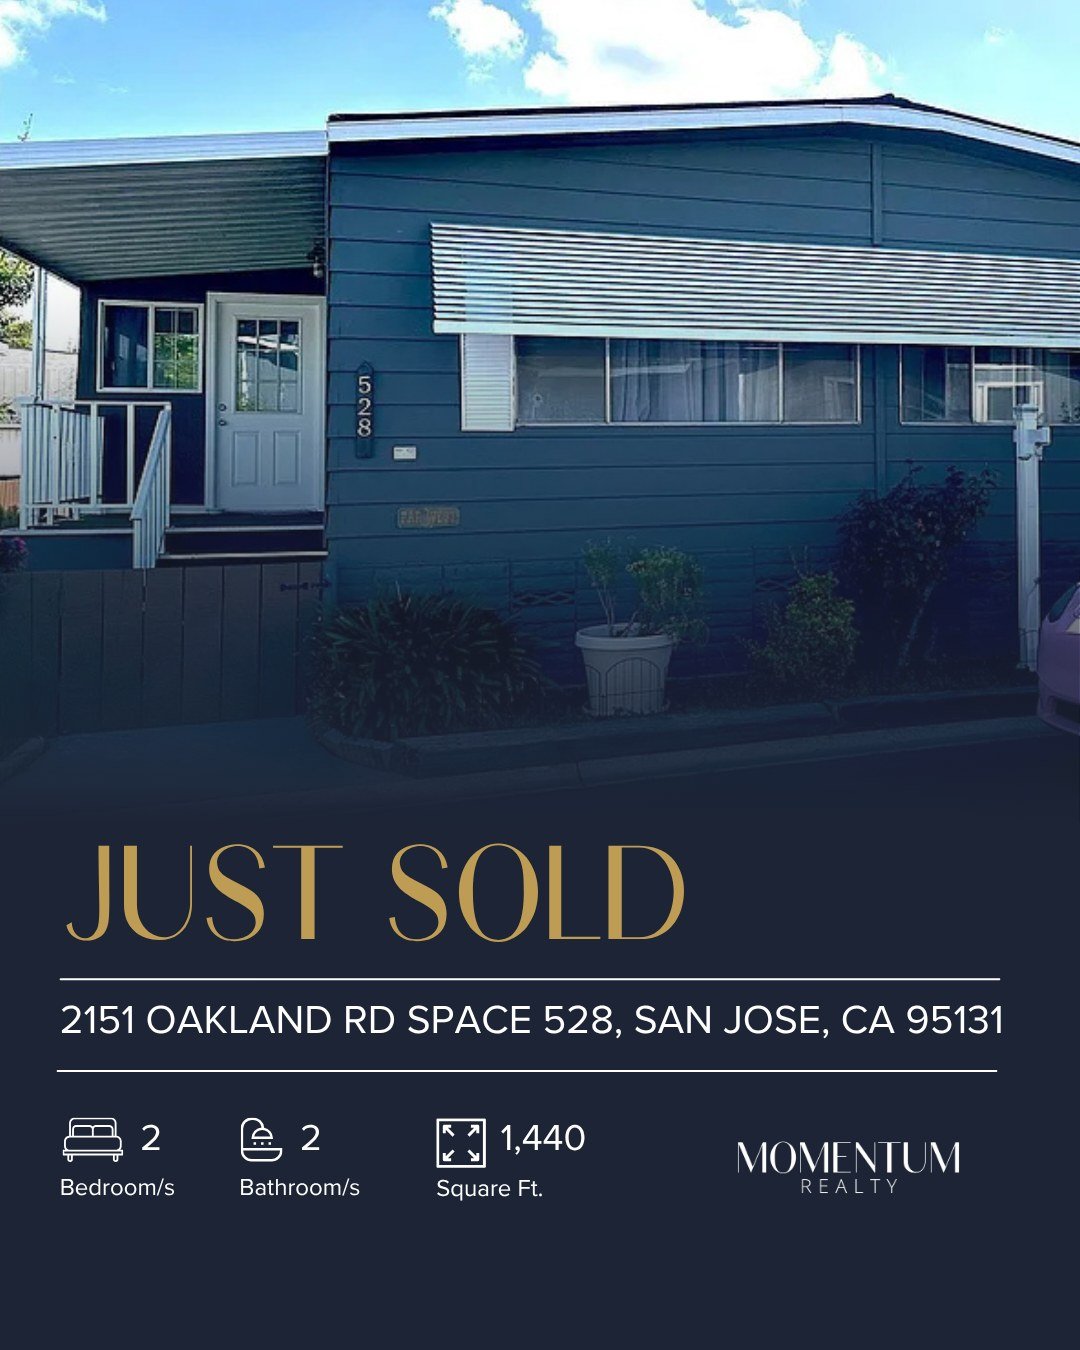
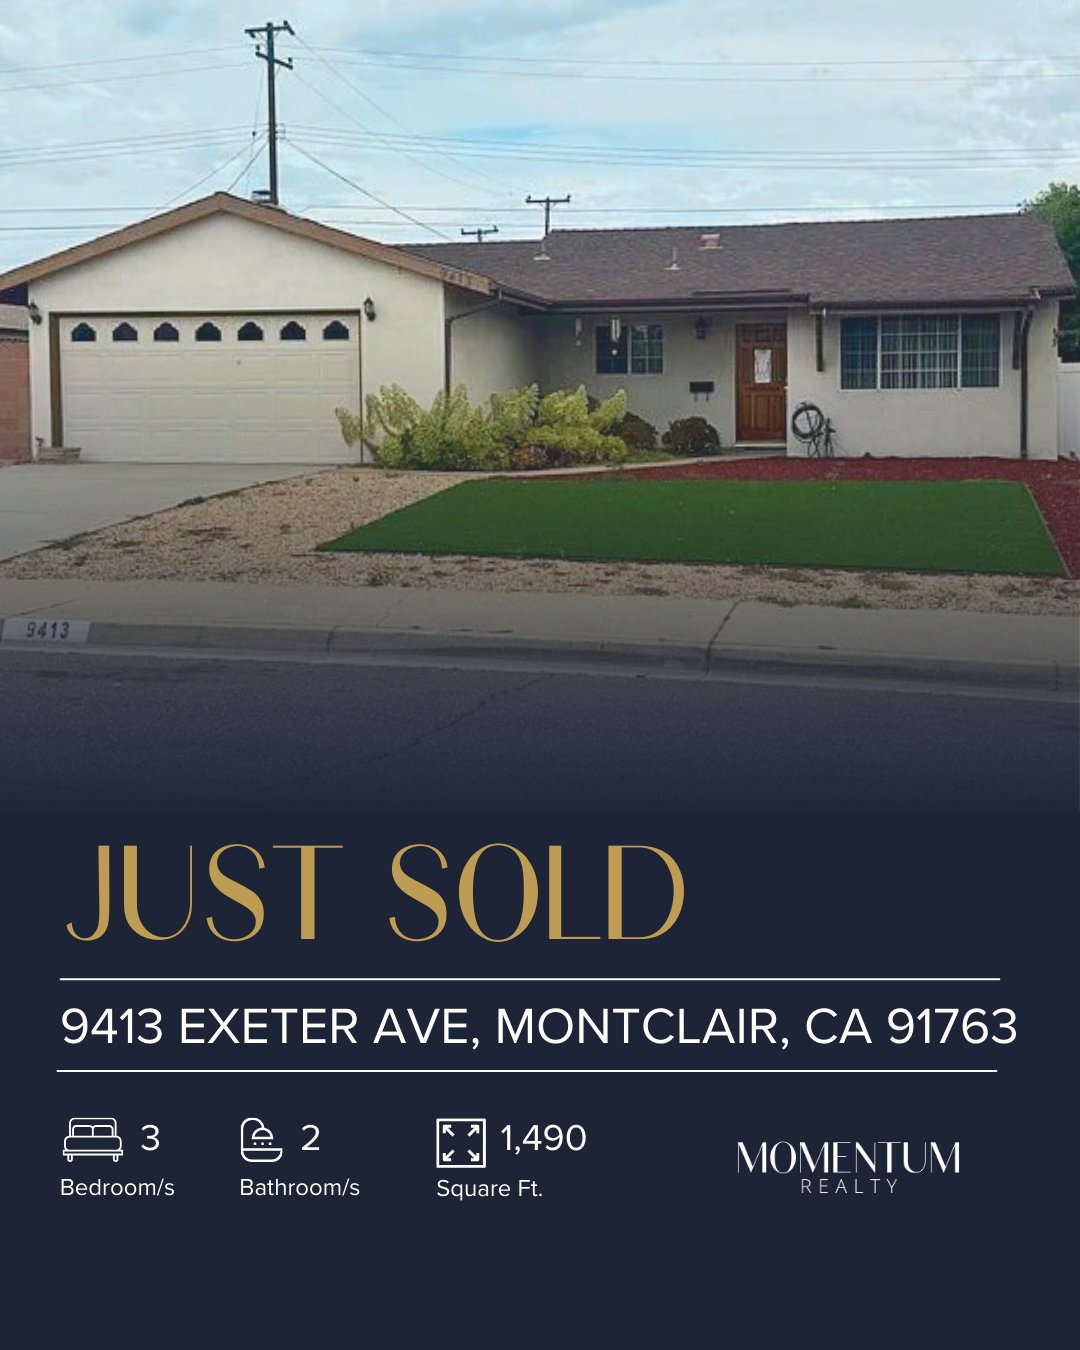
Featured ListingFeatured Listing
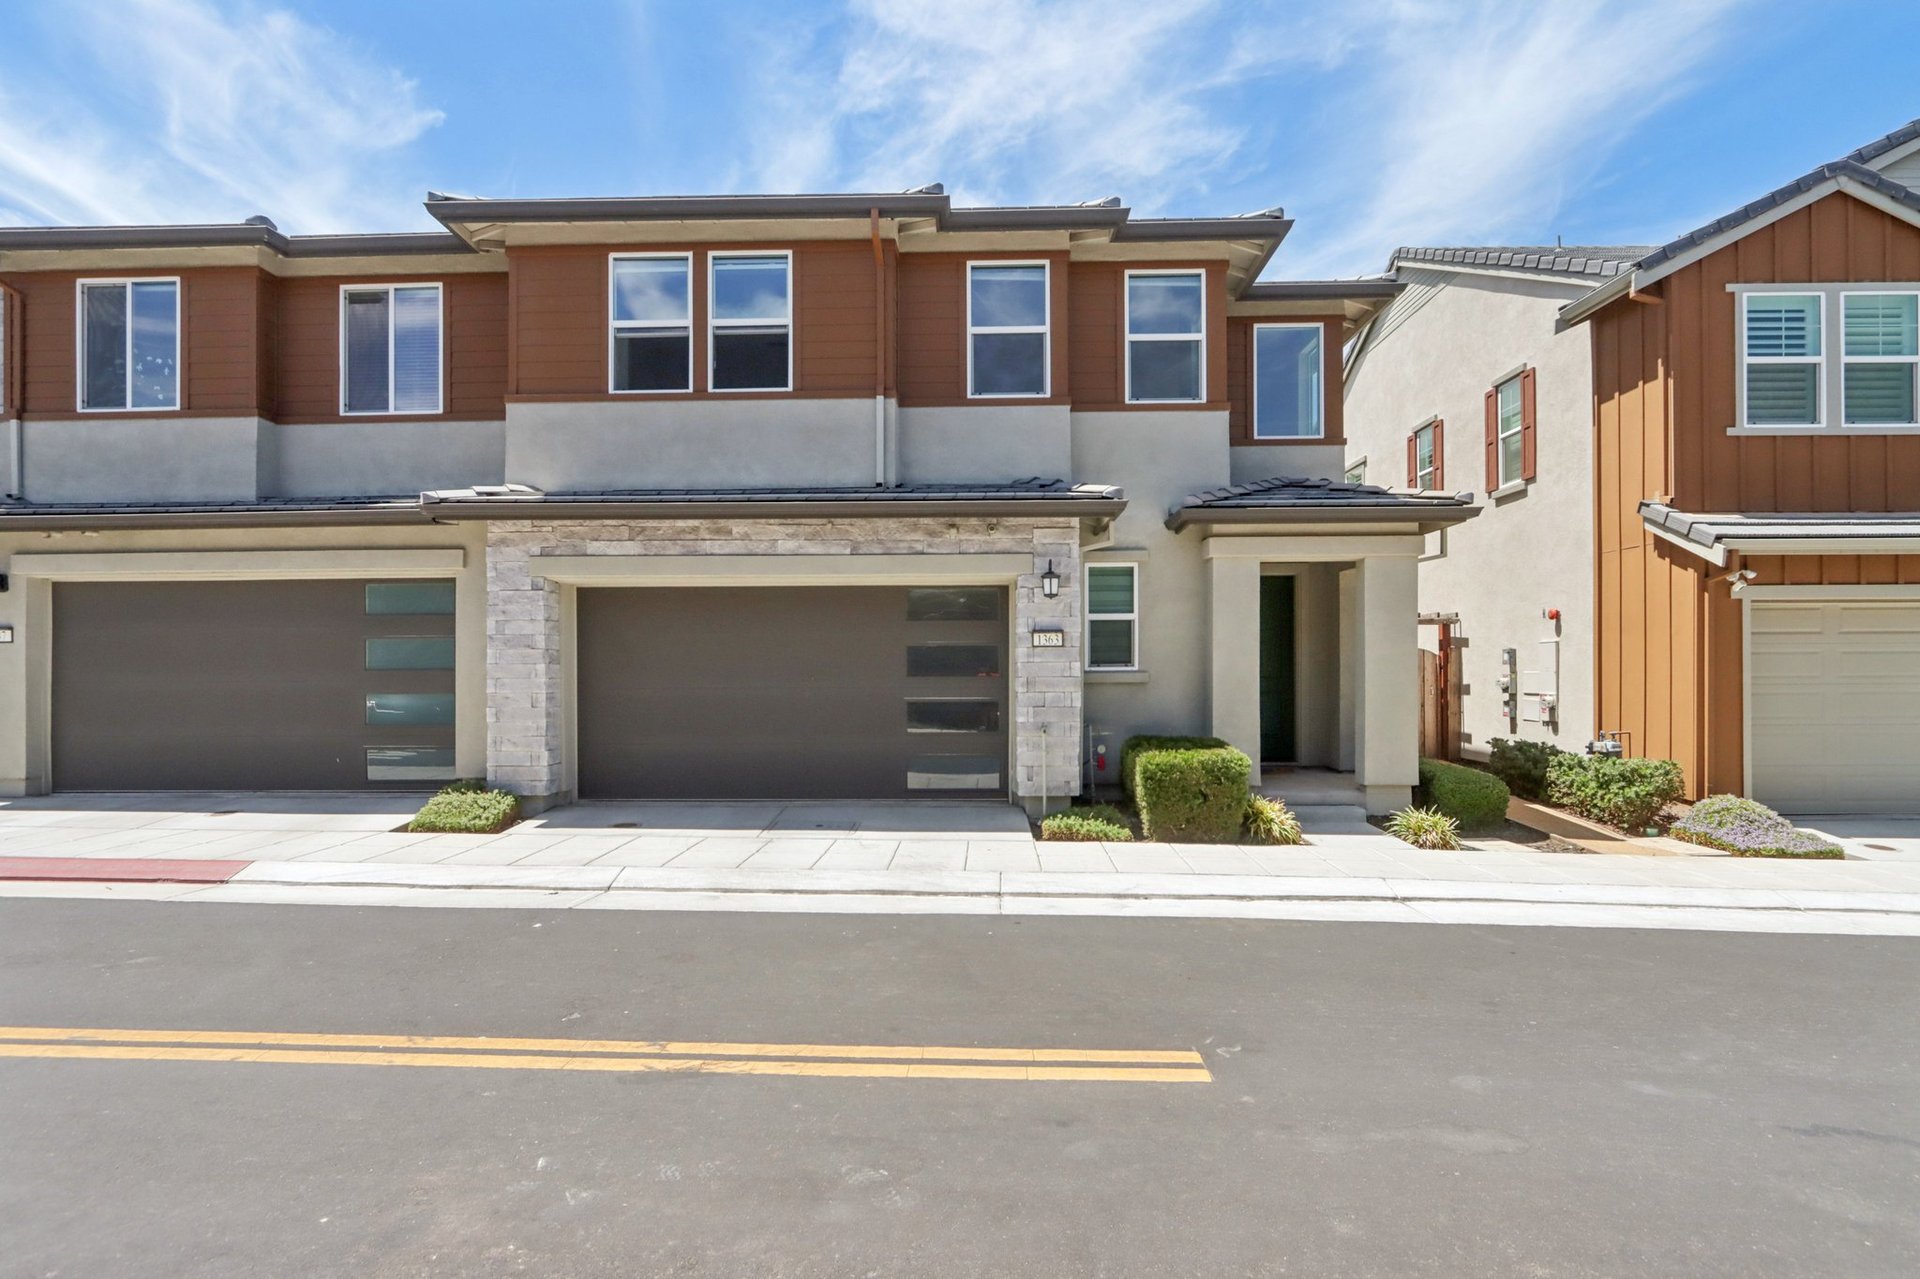
1363 S Shields Ave Tracy, CA 95391
3 Beds | 3 Baths | 1,831 Sq Ft
🏡 3 Bedrooms, 2.5 Bathrooms | 🍳 Upgraded Chef’s Kitchen
🌳 Premium Elevated Lot | 🚗 Attached 2-Car Garage
NEWS