Leave a Message

Thank you for your message. We will be in touch with you shortly.

✨ October Update | CA Newsletter

✨ October  Update | CA Newsletter


Welcome to our October Newsletter

We’re bringing you the latest housing market highlights.

 
In September, housing markets across Santa Clara, Alameda, San Mateo, and Los Angeles counties maintained a steady balance between buyer demand and seller expectations. Key metrics—average days on market (DOM) and sale-to-list price ratio—offer insight into both the speed of sales and the strength of buyer competition. Although each county reflects its own unique trends, the broader picture reveals a market that remains active and competitive, with pace and intensity adjusting in response to season.
 
Santa Clara County: Average Days on Market and Sale to List Price Ratio
 
 
Santa Clara County (SCC) from October 2024 to September 2025, focusing on the relationship between sale performance and market activity. The light blue bars display the Sale-to-List Ratio (%), while the yellow line represents the number of closed sales each month. Starting the axis at 100% highlights subtle fluctuations more clearly. The data shows that the market peaked in February 2025 with a 109.1% sale-to-list ratio—homes were selling well above asking prices—before gradually moderating toward 102%–103% by late summer 2025. Meanwhile, closed sales peaked in December 2024 and August 2025 (26 each), reflecting strong seasonal demand, with the lowest activity in March 2025 (13 sales). Overall, the graph suggests a competitive early-year market followed by a steady normalization through mid to late 2025.
 
 
Alameda: Average Days on Market and Sale to List Price Ratio
 
 
Alameda County (ALC) from October 2024 to September 2025, showing both pricing performance and market activity. The light blue bars represent the Sale-to-List Ratio (%), while the yellow line shows the number of closed sales each month. Starting the y-axis at 100% makes the month-to-month variations easier to observe.
 
The Sale-to-List Ratio peaked in March 2025 at 109.4%, suggesting a highly competitive market with homes selling well above list prices. Other strong months include February (108.1%) and April (108.0%), maintaining elevated demand levels. However, the ratio gradually declined to around 104%–105% by summer, reflecting a moderate market cooling.
 
Meanwhile, closed sales reached their highest levels in January 2025 (35) and December 2024 (34), indicating strong year-end and early-year activity. The lowest volume occurred in March 2025 (17), aligning with seasonal adjustments. Overall, the Alameda market demonstrated a vigorous start to 2025, followed by steady normalization through mid to late 2025, balancing out after a surge in buyer competition.
 
San Mateo County: Average Days on Market and Sale to List Price Ratio


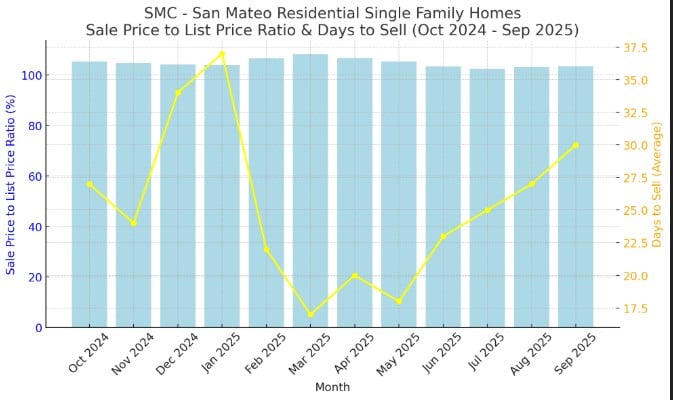
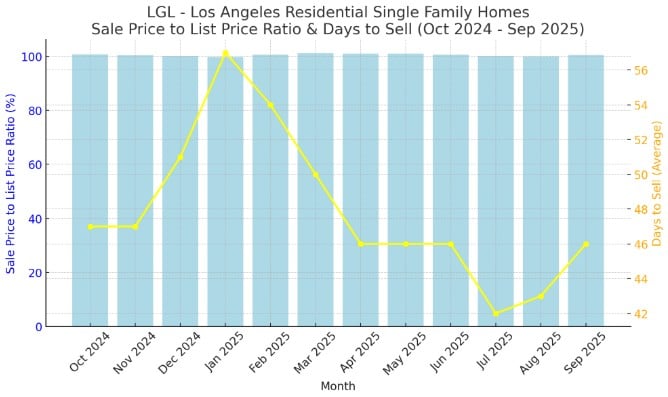
From October 2024 to September 2025, the Residential Single Family Home market in San Mateo County showed a gradual cooling after a strong start to the year. The light blue bars (representing the Sale-to-List Ratio) would range from around 108.2% in March 2025, marking the most competitive month, down to 102.4% in July 2025, the lowest point—indicating that homes sold closer to their asking prices midyear. The yellow line (representing Closed Sales Count) would show peaks in January 2025 (37 sales) and December 2024 (34 sales), suggesting heightened buyer activity during the winter months.

Overall, the trend reveals a robust early 2025 market with sellers achieving strong returns, followed by a gradual normalization into late summer, aligning with broader regional cooling trends.


Los Angeles: Average Days on Market and Sale to List Price Ratio
 
 
Los Angeles County (LGL) for Residential Single Family Homes from October 2024 to September 2025. The light blue bars represent the Sale Price to List Price Ratio (%), which indicates how closely home sale prices aligned with their original listing prices. Meanwhile, the yellow line shows the average Days to Sell, reflecting how long properties typically remained on the market before being sold.
 
Overall, the data reveals a generally stable and competitive market throughout the year. The highest sale-to-list ratio occurred in March 2025 (101.1%), suggesting that homes were selling slightly above their asking prices, likely due to strong buyer demand. Conversely, the slowest period was observed in January 2025, when properties took an average of 57 days to sell—typical for a seasonal dip during the winter months. From April to September 2025, both indicators stabilized, with sale-to-list ratios averaging around 100% and homes selling within 42 to 46 days, signaling a balanced and consistent housing market in Los Angeles during this period.


Congratulations to our clients on their successful closings this month!


Featured Listing

📐 1,720 Sqft
🏡 4 Beds | 🛁 4 Baths
 
✨ Elegantly Upgraded Interior Design
🍳 Chef-Inspired Modern Kitchen
☀️ Tesla Solar Energy System
🏠 Private Guest Suite Access
 
 
📐 954 Sqft
🏡 2 Beds | 🛁 2 Baths
 
🚗 Single Carport + Extra Storage
🍳 Modern Kitchen with Quartz Countertops
🧺 In-Unit Laundry
🪴 Open, Low-Maintenance Layout
🏊‍♂️ Solar-Heated Community Pool with Cabana
 

News


Let's Talk

You’ve got questions and we can’t wait to answer them.